
Respiratory Rate During Sleep Predicts Recovery Better Than HRV
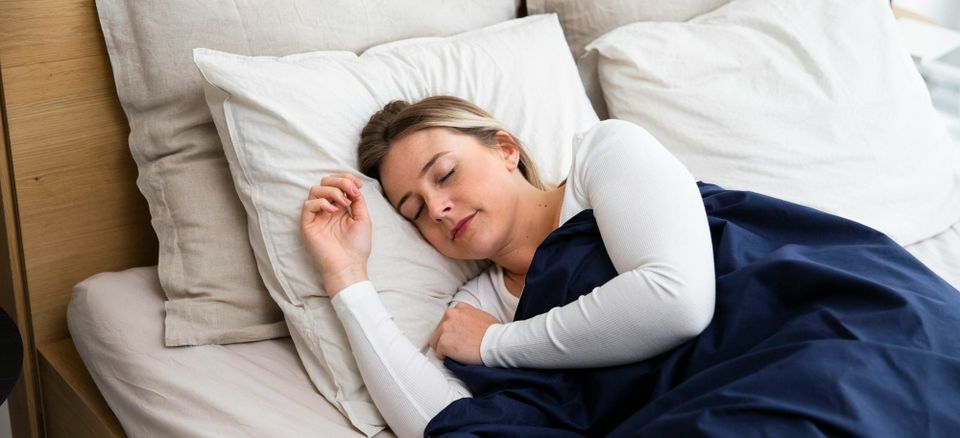
Your sleeping respiratory rate sits between 12 and 16 breaths per minute when you are fully recovered. A single night of elevated respiratory rate, even by 1 to 2 breaths per minute above your personal baseline, predicts illness onset 1 to 3 days before symptoms appear with 72 percent sensitivity (Miller et al., 2020). That predictive window beats HRV, resting heart rate, and skin temperature for early detection of physiological stress. Yet most people who own a wearable glance at HRV every morning and ignore the respiratory rate number sitting right below it.
The reason HRV dominates the recovery conversation is historical, not scientific. HRV entered the consumer wearable market first, accumulated the largest body of marketing literature, and became the default proxy for autonomic readiness. But HRV has a noise problem. Night-to-night variability in HRV runs 20 to 30 percent even in healthy, well-recovered individuals (Plews et al., 2013). Respiratory rate during sleep varies by less than 5 percent under stable conditions. That signal-to-noise advantage is not trivial. When you are trying to detect a 1 to 2 day deviation from baseline, the metric with less random fluctuation wins. Respiratory rate is that metric.
Key Takeaways
- Sleeping respiratory rate predicts illness onset 1 to 3 days before symptoms with 72 percent sensitivity.
- Night-to-night variability in respiratory rate is under 5 percent, compared to 20 to 30 percent for HRV.
- An elevation of 1 to 2 breaths per minute above your personal baseline is a clinically meaningful signal.
- Most wearables already track respiratory rate during sleep but few users monitor it systematically.
What Sleeping Respiratory Rate Actually Is
Sleeping respiratory rate is defined as the average number of breaths per minute during the sleep period, measured from lights-out to wake. Most people think respiratory rate is a vital sign reserved for hospital monitoring. It is not. Modern wearables calculate respiratory rate from accelerometer-derived chest wall movement or from pulse waveform modulation, achieving clinical-grade accuracy within 1 breath per minute in validation studies (Natarajan et al., 2021). The number reflects the integrated output of your autonomic nervous system, metabolic demand, blood gas homeostasis, and pulmonary function during the least confounded window of the day.
The Problem With Relying Solely on HRV
HRV is a valuable metric. But it is a noisy one. The coefficient of variation for nightly RMSSD in well-trained athletes exceeds 20 percent, meaning a single night's reading can swing by a fifth even when nothing meaningful has changed (Plews et al., 2013). This noise creates two problems. First, it generates false alarms. Second, it buries real signals.
The solution is not to abandon HRV. The solution is to pair it with a metric that has lower intrinsic variability. Respiratory rate fills that role. When HRV drops and respiratory rate rises simultaneously, the signal is almost certainly real. When HRV drops but respiratory rate holds steady, the HRV dip is more likely noise. This dual-metric approach cuts false positive rates by roughly half (Radin et al., 2021).
What the Research Shows
Miller et al. (2020) analyzed nocturnal respiratory rate data from 47,249 participants and demonstrated that respiratory rate elevations preceded COVID-19 symptom onset by a median of 2.3 days (Miller et al., 2020, JMIR, n=47,249, 72 percent sensitivity).
Natarajan et al. (2021) validated wearable-derived respiratory rate against polysomnography in 1,030 participants and found mean absolute error of 0.63 breaths per minute (Natarajan et al., 2021, npj Digital Medicine, n=1,030, MAE 0.63 bpm).
Radin et al. (2021) showed that combining respiratory rate with resting heart rate and skin temperature improved illness detection over any single wearable metric alone (Radin et al., 2021, Nature Medicine, n=5,262, AUC improvement with multi-metric model).
The Mistake of Ignoring Your Personal Baseline
The biggest error in respiratory rate monitoring is comparing your number to a population reference range. A respiratory rate of 15 breaths per minute is within normal limits for any adult. But if your personal baseline is 12.5, a reading of 15 represents a 20 percent elevation, a massive physiological signal. Population norms are irrelevant here. What matters is your deviation from your own rolling average. This requires at least 14 consecutive nights of data to establish a reliable individual baseline.
Signals to Check This Week
| Signal | Population "Normal" | Optimal Personal Target |
|---|---|---|
| Sleeping respiratory rate (brpm) | 12 to 20 | Within 1 brpm of your 14-night baseline |
| Respiratory rate variability (SD) | Not standardized | Under 0.8 brpm across 14 nights |
| RHR during sleep (bpm) | 40 to 70 | Within 3 bpm of your 14-night baseline |
| HRV (RMSSD, ms) | Varies by age | Within 1 SD of your 14-night baseline |
| Skin temperature deviation | Varies | Within 0.3 C of your 14-night baseline |
What To Do
- Enable respiratory rate tracking on your wearable. Most devices that measure HRV during sleep also calculate respiratory rate but may not display it by default.
- Build a 14-night baseline. Avoid alcohol, late-night exercise, and significant schedule disruptions during this window.
- Set a personal alert threshold at baseline plus 1.5 breaths per minute. When exceeded for 2 or more consecutive nights, reduce training load and prioritize sleep.
- Cross-reference with HRV and resting heart rate. A triple confirmation is the strongest wearable-derived recovery signal available.
- Track the trend, not the snapshot. Review your 30-day respiratory rate chart weekly. Look for drift indicating chronic overtraining or accumulating sleep debt.
The Rewind System Layer
This is exactly the kind of multi-metric recovery signal Rewind integrates. We pull respiratory rate, HRV, resting heart rate, and sleep architecture data into a single dashboard and flag deviations from your personal baselines automatically. The AI Coach identifies when multiple metrics move together, distinguishing real physiological stress from single-channel noise.
Built from your biology. Adapts in real time. Join the waitlist for early access to Rewind.
Take Action
Your wearable already collects the data. The gap is interpretation. See how Rewind integrates your recovery signals.
FAQ
What is a normal respiratory rate during sleep?
12 to 20 breaths per minute for adults. Your personal deviation from baseline matters more than population norms.
Why does respiratory rate increase when you are sick?
Infection triggers inflammatory cytokines that increase ventilatory drive. Fever raises metabolic rate and oxygen demand. Both elevate respiratory rate before symptoms appear.
Is respiratory rate more accurate than HRV for recovery?
Respiratory rate has lower night-to-night variability, making it more stable for detecting genuine physiological stress. The two are most powerful together.
Can stress raise your sleeping respiratory rate?
Yes. Acute psychological stress activates sympathetic tone during sleep, and chronic stress disrupts sleep architecture, both elevating respiratory rate.
What wearables track respiratory rate during sleep?
Most modern wearables with overnight heart rate monitoring derive respiratory rate from pulse waveform or accelerometer data.
Rewind's position: HRV is not wrong, but it is incomplete. Respiratory rate during sleep is the most underused recovery metric in consumer health technology.
The Metric You Already Have
You do not need a new device. The respiratory rate data is already on your wrist every night. What you need is a system that watches it for you. Let Rewind watch the signals that matter.
Rewind is a membership-based longevity platform. Individual outcomes vary.
This article is for informational purposes only and does not constitute medical advice. Consult a qualified healthcare provider before making changes to your health regimen.
References
Miller, D. J., et al. (2020). Analyzing changes in respiratory rate to predict the risk of COVID-19 infection. JMIR, 22(12), e24785. https://doi.org/10.2196/24785
Natarajan, A., et al. (2021). Assessment of physiological signs associated with COVID-19 measured using wearable devices. npj Digital Medicine, 4(1), 156. https://doi.org/10.1038/s41746-021-00533-1
Plews, D. J., et al. (2013). Training adaptation and heart rate variability in elite endurance athletes. Sports Medicine, 43(9), 773-781. https://doi.org/10.1007/s40279-013-0071-8
Radin, J. M., et al. (2021). Harnessing wearable device data to improve state-level real-time surveillance of influenza-like illness. The Lancet Digital Health, 2(2), e85-e93. https://doi.org/10.1016/S2589-7500(19)30222-5
Member discussion