
Arterial Stiffness: Pulse Wave Velocity Is Your Vascular Age
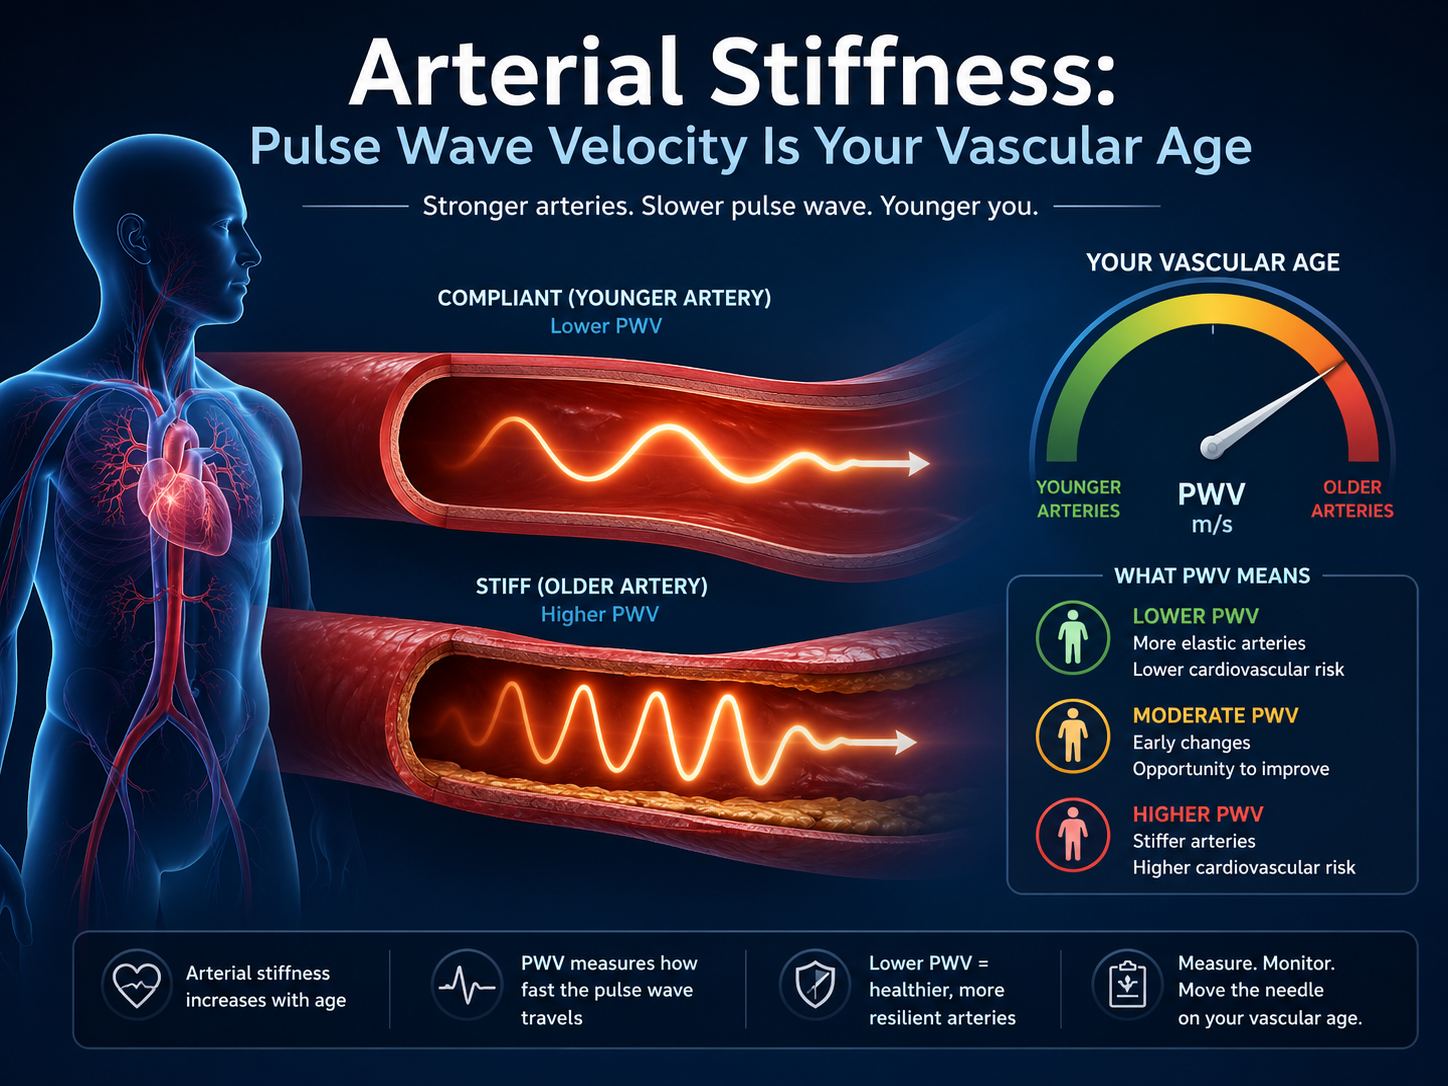
Carotid-femoral pulse wave velocity above 10 m/s doubles cardiovascular event risk independently of blood pressure, cholesterol, and every other traditional risk factor (Ben-Shlomo et al., 2014). That threshold was established in a meta-analysis of 17,635 participants across 16 studies, making it one of the most robust cardiovascular risk signals in the literature. Pulse wave velocity, or PWV, measures the speed at which the arterial pressure wave travels from the heart to the periphery. Stiff arteries transmit the wave faster. Compliant arteries absorb it. The number is a direct physical measurement of your vascular age, and it can diverge from your chronological age by decades in either direction.
Yet PWV remains absent from standard cardiovascular screening. Your annual physical measures blood pressure, which is a downstream consequence of arterial stiffness, not the stiffness itself. The distinction matters. Blood pressure can be pharmacologically controlled while the underlying arterial wall continues to stiffen. A person on antihypertensives with a normal blood pressure of 125/78 may still have a PWV of 12 m/s, placing them at twice the population risk for stroke, heart failure, and renal decline. The blood pressure number offers false reassurance. The PWV number does not.
Key Takeaways
- Pulse wave velocity above 10 m/s doubles cardiovascular event risk independently of blood pressure and lipids.
- PWV measures arterial stiffness directly, while blood pressure measures a downstream consequence.
- Arterial stiffness is modifiable through exercise, sodium reduction, and blood pressure management.
- PWV can be assessed non-invasively in under 15 minutes with validated devices.
What Pulse Wave Velocity Actually Is
Pulse wave velocity is defined as the speed at which the arterial pressure pulse propagates along the arterial tree, measured in meters per second, and used as the reference standard for arterial stiffness assessment. Most people think blood pressure is the primary measure of vascular health. It is not. Blood pressure is a hemodynamic variable influenced by cardiac output, peripheral resistance, and vascular compliance. PWV isolates the compliance component (Laurent et al., 2006). A higher number means stiffer arteries. A lower number means more compliant ones.
The Problem With Blood Pressure Alone
Blood pressure screening has been the cornerstone of cardiovascular risk assessment for 60 years. But it has a critical blind spot. Blood pressure does not distinguish between a young, compliant vasculature generating 130/80 through high cardiac output and an old, stiff vasculature generating 130/80 through reduced output against rigid walls. These two scenarios carry different prognoses, but blood pressure treats them as identical.
Arterial stiffness increases continuously with age, beginning in the late 20s and accelerating after 50 (Reference Values for Arterial Stiffness Collaboration, 2010). The primary mechanism is fragmentation of elastin fibers and deposition of collagen in the arterial media, driven by mechanical fatigue, glycation, and chronic low-grade inflammation. Treating the blood pressure number without measuring the stiffness that produces it is equivalent to treating a fever without looking for the infection.
What the Research Shows
Ben-Shlomo et al. (2014) conducted an individual participant meta-analysis of 17,635 subjects and found that each 1 m/s increase in PWV was associated with a 15 percent increase in cardiovascular events and all-cause mortality after full adjustment (Ben-Shlomo et al., 2014, JACC, n=17,635, HR 1.15 per m/s increment).
Vlachopoulos et al. (2010) demonstrated that PWV predicted cardiovascular events with greater accuracy than any individual traditional risk factor, with 13 percent net reclassification improvement over the Framingham Risk Score (Vlachopoulos et al., 2010, JACC, n=15,877).
Mattace-Raso et al. (2006) showed in the Rotterdam Study that the highest quartile of PWV carried 2.4 times the risk of the lowest quartile for coronary heart disease and stroke (Mattace-Raso et al., 2006, Circulation, n=2,835, HR 2.4).
The Mistake of Assuming Normal Blood Pressure Means Healthy Arteries
The single most dangerous assumption in cardiovascular screening is that controlled blood pressure equals vascular health. It does not. Some antihypertensives improve arterial compliance. Others do not. A patient on atenolol may achieve target blood pressure while their central aortic stiffness continues to worsen. Without measuring PWV, neither the patient nor the physician knows whether the underlying structural problem is being addressed or merely masked. The CAFE study demonstrated that identical brachial blood pressures can correspond to significantly different central aortic pressures and PWV values, with divergent clinical outcomes (Williams et al., 2006).
Signals to Check This Week
| Signal | Lab "Normal" | Optimal Target |
|---|---|---|
| Carotid-femoral PWV (m/s) | Under 12 (age-dependent) | Under 8 (age 40 to 50) |
| Pulse pressure (mmHg) | Under 60 | Under 40 |
| Systolic BP (mmHg) | Under 140 | 110 to 120 |
| hsCRP (mg/L) | Under 3.0 | Under 0.5 |
| HbA1c (%) | Under 5.7 | Under 5.2 |
What To Do
- Get your pulse wave velocity measured. Ask your cardiologist or longevity physician. The measurement takes under 15 minutes and is non-invasive.
- Prioritize aerobic exercise. A meta-analysis of 42 trials found aerobic exercise reduced PWV by 0.63 m/s on average (Ashor et al., 2014). Aim for 150 minutes per week.
- Reduce sodium intake to under 2,300 mg per day. Chronic sodium excess accelerates arterial wall collagen deposition and impairs endothelial nitric oxide production (Sacks et al., 2001).
- Manage glycemic variability. Advanced glycation end products cross-link arterial collagen. Maintain HbA1c below 5.2 percent and minimize postprandial spikes above 140 mg/dL.
- Retest PWV annually. Arterial stiffness changes slowly. Annual measurement is sufficient to detect trends and validate your protocol.
The Rewind System Layer
This is exactly the kind of structural risk that standard screening misses. Rewind integrates vascular health metrics alongside metabolic, inflammatory, and epigenetic data so you can see whether your arteries are aging faster or slower than the rest of you. The AI Coach flags when pulse pressure trends or inflammatory markers suggest increasing stiffness.
Built from your biology. Adapts in real time. Join the waitlist for early access to Rewind.
Take Action
Your blood pressure reading tells you what is happening right now. Your PWV tells you what is coming next. Get your vascular age with Rewind.
FAQ
What is a good pulse wave velocity by age?
For adults aged 40 to 49, below 8 m/s is optimal. For ages 50 to 59, below 9 m/s. Above 10 m/s at any age doubles cardiovascular risk.
Can you reverse arterial stiffness?
Partially. Sustained aerobic exercise, sodium reduction, glycemic control, and blood pressure management can improve functional compliance. Complete reversal of structural elastin fragmentation is unlikely.
Is pulse wave velocity better than blood pressure?
They measure different things. PWV adds independent predictive value beyond blood pressure for cardiovascular events and mortality.
How is pulse wave velocity measured?
Two pressure sensors are placed at the carotid and femoral arteries. The time delay between pulse arrivals, divided by the distance, yields PWV in meters per second.
Does exercise reduce arterial stiffness?
Yes. A meta-analysis of 42 trials showed an average PWV reduction of 0.63 m/s with aerobic training, through improved endothelial function and enhanced nitric oxide availability.
Rewind's position: pulse wave velocity is the single most underused cardiovascular risk metric in clinical practice. We believe PWV should be a standard component of any longevity-oriented cardiovascular evaluation.
Beyond the Blood Pressure Cuff
If you are building a cardiovascular profile designed to predict the next 20 years rather than the next annual physical, vascular compliance belongs in the picture. See what a complete cardiovascular profile looks like at Rewind.
Rewind is a membership-based longevity platform. Individual outcomes vary.
This article is for informational purposes only and does not constitute medical advice. Consult a qualified healthcare provider before making changes to your health regimen.
References
Ashor, A. W., et al. (2014). Effects of exercise modalities on arterial stiffness and wave reflection. PLoS ONE, 9(10), e110034. https://doi.org/10.1371/journal.pone.0110034
Ben-Shlomo, Y., et al. (2014). Aortic pulse wave velocity improves cardiovascular event prediction. JACC, 63(7), 636-646. https://doi.org/10.1016/j.jacc.2013.09.063
Laurent, S., et al. (2006). Expert consensus document on arterial stiffness. European Heart Journal, 27(21), 2588-2605. https://doi.org/10.1093/eurheartj/ehl254
Mattace-Raso, F. U., et al. (2006). Arterial stiffness and risk of coronary heart disease and stroke: The Rotterdam Study. Circulation, 113(5), 657-663. https://doi.org/10.1161/CIRCULATIONAHA.105.555235
Reference Values for Arterial Stiffness Collaboration. (2010). Determinants of pulse wave velocity in healthy people. European Heart Journal, 31(19), 2338-2350. https://doi.org/10.1093/eurheartj/ehq165
Sacks, F. M., et al. (2001). Effects on blood pressure of reduced dietary sodium and the DASH diet. NEJM, 344(1), 3-10. https://doi.org/10.1056/NEJM200101043440101
Vlachopoulos, C., et al. (2010). Prediction of cardiovascular events and all-cause mortality with arterial stiffness. JACC, 55(13), 1318-1327. https://doi.org/10.1016/j.jacc.2009.10.061
Williams, B., et al. (2006). Differential impact of blood pressure-lowering drugs on central aortic pressure: Principal results of the CAFE study. Circulation, 113(9), 1213-1225. https://doi.org/10.1161/CIRCULATIONAHA.105.595496
Member discussion