
Fasting Insulin: The Early Warning Your Glucose Panel Misses
Your last blood panel probably came back "normal." Fasting glucose in range, HbA1c under 5.7, doctor says you're fine. But here's the number that wasn't on that panel: fasting insulin. And it might be the single most useful metabolic biomarker you've never been tested for. In a landmark database of 14,384 patients, more than half of those with perfectly normal glucose were already pumping out abnormally high insulin to keep it that way (Crofts et al., 2016, n=4,185 with normal glucose tolerance). Their pancreas was working overtime, and nobody noticed. That's the problem with only checking glucose. You're looking at the score, not the effort it takes to get there.
Fasting insulin is the metabolic smoke alarm that goes off a decade before the fire. By the time glucose rises, you've already lost ground you didn't know you were defending.
Key Takeaways
- Fasting insulin catches metabolic dysfunction 10 to 15 years before fasting glucose or HbA1c move.
- Optimal fasting insulin sits between 2 and 6 μIU/mL, not the lab "normal" of under 25.
- Over half of people with normal glucose already show hyperinsulinemia when insulin is measured.
- This is a cheap, widely available blood test most doctors simply don't order.
What Fasting Insulin Actually Tells You
Fasting insulin is the amount of insulin your pancreas releases when you haven't eaten for 8 to 12 hours. Think of it as the idle speed of your metabolic engine. When your cells stop responding efficiently to insulin, a condition called insulin resistance, your pancreas compensates by producing more. Glucose stays normal. Everything looks fine on paper. But the engine is revving higher than it should just to maintain cruising speed.
Most people think insulin only matters if you have diabetes. In practice, this means your body can be losing its metabolic flexibility for years while every standard lab result stays in the green.
Why Your Standard Panel Fails You
The standard metabolic panel checks fasting glucose and, if your doctor is thorough, HbA1c. Both measure what happens to sugar in your blood. Neither measures how hard your body is working to keep that sugar in range.
This is like checking whether your car is still moving without looking at the tachometer. The engine might be redlining to maintain 60 miles per hour. It's still moving. It's also about to break down.
Joseph Kraft spent 20 years running insulin alongside glucose tolerance tests on 14,384 patients at St. Joseph Hospital in Chicago. His findings rewrote what we should consider "healthy." Of the patients with completely normal glucose clearance, 50.3% already had hyperinsulinemia, abnormally elevated insulin output despite textbook glucose numbers (Crofts et al., 2016). Kraft called this "diabetes in situ," the disease hiding in plain sight.
The clinical gap is enormous. Fasting glucose doesn't budge until your pancreas starts failing. HbA1c is a trailing indicator that averages 2 to 3 months of glucose. Fasting insulin is the leading indicator that shows strain before anything else moves.
The Lab Range Trap
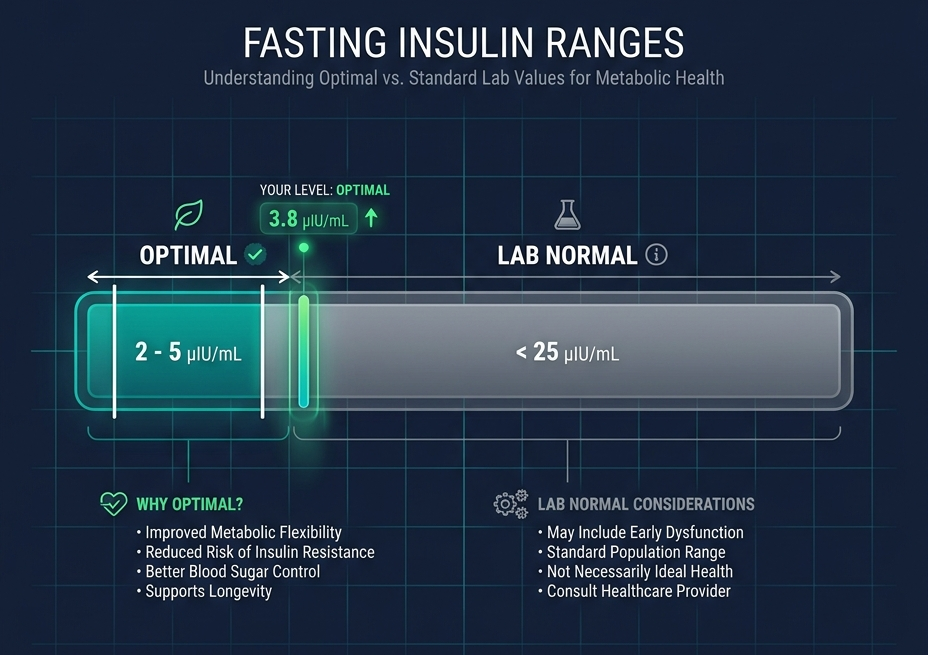
The most common mistake with fasting insulin is trusting the reference range on your lab report. Most labs flag anything under 25 μIU/mL as normal. Some go as high as 29. That range was built to identify overt diabetes, not to catch early metabolic drift.
A fasting insulin of 18 gets stamped "normal" on paper. But population data paints a different picture. Medians in carefully screened healthy populations land between 4 and 7 μIU/mL. Levels above 10 to 12 consistently correlate with measurable insulin resistance. Above 15, cardiovascular risk starts climbing in a dose-dependent way. A meta-analysis of 7 prospective studies covering 26,976 non-diabetic adults found that higher fasting insulin levels were associated with increased all-cause mortality, with the relationship strengthening when combined with HOMA-IR calculation (Gao et al., 2017).
So that "normal" 18? It's roughly 3 times the optimal midpoint. Your lab says you're fine. The data says you're compensating.
Numbers Worth Tracking This Week
| Signal | Lab "Normal" | Optimal Target |
|---|---|---|
| Fasting insulin | Under 25 μIU/mL | 2 to 6 μIU/mL |
| HOMA-IR | Under 2.5 | Under 1.0 |
| Fasting glucose | 70 to 100 mg/dL | 72 to 88 mg/dL |
| HbA1c | Under 5.7% | 4.8 to 5.3% |
| Triglyceride-to-HDL ratio | Under 3.5 | Under 1.5 |
Read these together. A fasting insulin of 9 with a fasting glucose of 92 and a triglyceride-to-HDL ratio of 2.8 tells a story that no single number tells alone. Your body is working harder than it should.
What to Do About It
1. Get fasting insulin added to your next blood panel. It costs between 10 and 30 dollars at most labs. You may need to specifically request it since it's not part of a standard metabolic panel. Ask for "fasting insulin, serum" alongside your glucose and lipid panel. Do this before your next annual physical.
2. Calculate your HOMA-IR. The formula is simple: (fasting insulin × fasting glucose) / 405. Under 1.0 is optimal. Between 1.0 and 1.9 is early insulin resistance. Over 2.0 warrants a serious conversation with your clinician. You can do this math on your phone the day your results come in.
3. Prioritize resistance training and walking after meals. Skeletal muscle is your largest glucose sink. A 15-minute walk after your biggest meal of the day can reduce postprandial insulin spikes by 30 to 50%. Resistance training 3 times per week improves insulin sensitivity within 2 weeks, even before body composition changes (Bird & Hawley, 2017).
4. Reduce refined carbohydrate load, especially at breakfast. Swapping a cereal-and-juice breakfast for one built on protein and fat (eggs, avocado, nuts) can cut morning insulin output in half. The first meal of the day sets insulin tone for the next 6 to 8 hours.
5. Retest at 90 days. Fasting insulin responds to lifestyle changes faster than most biomarkers. A 90-day retest gives you enough signal to know whether your interventions are working.
This is exactly the kind of metabolic signal Rewind tracks. We measure fasting insulin alongside your full biomarker panel so you can see insulin resistance forming and reversing in real time, without waiting for glucose to catch up.
Get Your Fasting Insulin Tested
If you haven't measured fasting insulin, you're flying blind on metabolic health. Start tracking it through Rewind.
Frequently Asked Questions
What is a normal fasting insulin level?
Lab "normal" is under 25 μIU/mL, but optimal is between 2 and 6. Anything above 10 suggests your pancreas is working harder than it should to keep glucose in range, even if your glucose looks fine.
Can fasting insulin be too low?
Rarely. Very low fasting insulin (under 2 μIU/mL) in the presence of normal or elevated glucose could indicate type 1 diabetes or late-stage pancreatic exhaustion. For most people, lower fasting insulin is better.
How is fasting insulin different from HOMA-IR?
Fasting insulin is a direct measurement. HOMA-IR is a calculated ratio that multiplies fasting insulin by fasting glucose and divides by 405. HOMA-IR gives context by accounting for glucose levels, but fasting insulin is the raw input and the number your doctor needs to order.
Does fasting insulin change with age?
It tends to rise with age, partly because insulin sensitivity declines and partly because body composition shifts toward more visceral fat. But the rise is not inevitable. People who maintain muscle mass, sleep quality, and metabolic flexibility can keep fasting insulin under 6 well into their 60s.
How often should I test fasting insulin?
Twice per year if your numbers are optimal. Every 90 days if you're actively working to bring insulin resistance down. The feedback loop matters. You need data points close enough together to see whether your changes are landing.
Rewind's position: fasting insulin is the most underordered biomarker in preventive medicine. If your doctor only checks glucose, you're seeing the lagging indicator. Insulin tells you what's coming.
Your next blood draw is an opportunity. Add one line to the order. It costs less than a good lunch, and it tells you more about your metabolic future than almost anything else on the panel. Start with Rewind and track how your insulin responds to the changes you're already making.
References
Bird, S. R., & Hawley, J. A. (2017). Update on the effects of physical activity on insulin sensitivity in humans. BMJ Open Sport & Exercise Medicine, 2(1), e000143. https://doi.org/10.1136/bmjsem-2016-000143
Crofts, C., Zinn, C., Wheldon, M., & Schofield, G. (2016). Identifying hyperinsulinaemia in the absence of impaired glucose tolerance: An examination of the Kraft database. Diabetes & Metabolic Syndrome: Clinical Research & Reviews, 10(2), S119-S123. https://doi.org/10.1016/j.dsx.2016.03.034
Gao, F., Zheng, K. I., Wang, X. B., Sun, Q. F., Pan, K. H., Wang, T. Y., ... & Zheng, M. H. (2017). Fasting insulin, insulin resistance, and risk of cardiovascular or all-cause mortality in non-diabetic adults: A meta-analysis. Bioscience Reports, 37(5), BSR20170947. https://doi.org/10.1042/BSR20170947
Kraft, J. R. (2008). Diabetes Epidemic & You. Trafford Publishing.
Reaven, G. M. (1988). Role of insulin resistance in human disease. Diabetes, 37(12), 1595-1607. https://doi.org/10.2337/diab.37.12.1595
Member discussion